GitHub repository for my forecasting code
11 June 2014I’ve put up a GitHub repository of the code I’ve used to aid my forecasting.
Right now I’ve just got the previously discussed Bluefin-21 model, a model for the “Will NASA land a telepresence robot on Venus by 2020?” question, and some code that pulls down citation information from Google Scholar and crunches it for “Will there be at least one female winner of a Fields Medal in 2014?”.
My Venus model presupposes there are three launch windows (2015, 2016 and 2018) for Venus. I also mention that in my comment on SciCast, though I don’t mention how I determined that.
I’m going to assume you have a reasonable mental model of planets, and their orbits around the Sun. Further, you believe that with current propulsion techniques, there are better and worse times to launch when you want to get to another planet.
Ok, first step, you hit up JPL’s HORIZONS web site. Set your Target Body to Venus (it’ll be 299; that’s the NAIF SPICE ID for Venus), the Time Span to run from 2014-7-1 to 2020-1-1 with a step size of 1 calendar month. Pull up the table settings and turn off everything except #20 Observer range & range-rate. Hit Generate Ephemeris. Bam, you’ve got a table of how far apart Venus and the Earth are, on a monthly basis, for the chunk of time under consideration in the question.
You could plot it, and you’d get something looking suspiciously like this:
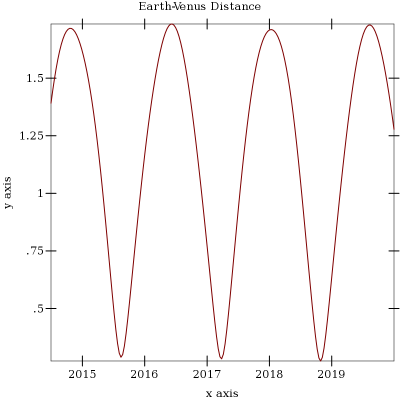
Hey look, three dips, almost in the three years I mention. Those correspond to the points when the planets are closest, and are roughly the best time to try and get from the Earth to Venus. Since Venus zips around the Sun quite a bit faster than the Earth, every close approach is Venus “catching up” with us.
The best plan for launching, then, is to kick it out of orbit into the direction of Venus, and let Venus catch up to it. The transit then just takes a few months. You can work out a good time to launch by shaving a few months off each of the minimums on the graph. That’s why the 2017 dip corresponds to a (late) 2016 launch window.